
The historian and sociologist W.E.B. DuBois believed that social science data should be evocative. In the 2018 essay collection W.E.B. Du Bois’s Data Portraits: Visualizing Black America, architecture scholar Mabel O. Wilson describes how Du Bois used infographics and various artistic media to counter assertions by Georg Wilhelm Friedrich Hegel that Africans were “incapable of any development of culture” and that the black experience was characterized by “sensuous arbitrariness.” In the same volume, designer Silas Munro explains just how important the arts were for Du Bois’s scientific argument: “The Du Bois infographics were published twenty years before the founding of Bauhaus,” and their modular style predated “the rise of dominant European avant-garde movements… considered to have their origins in Russian constructivism, De Stijl, and Italian futurism.” Du Bois’s charts are both scientific and evocative. And they are provocative. They draw in viewers to study them, to make new insights, to raise new questions, and to take positive action.
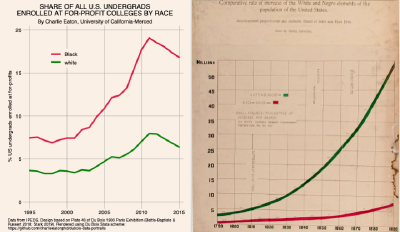
This toolkit expands the Du Boisian-inspired work in our Student Debt Initiative. As part of that project, the Dignity and Network and the VizE Lab at Princeton adopted the style of Du Bois in a series of charts “The Problem of the Colored Lines” and an interactive student loan re-calculator that depict contemporary research on how racial color lines organize data on student loan debt.
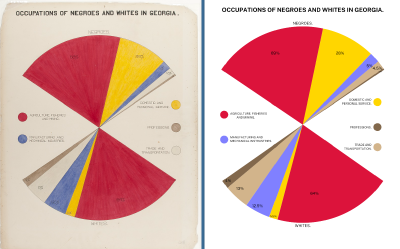
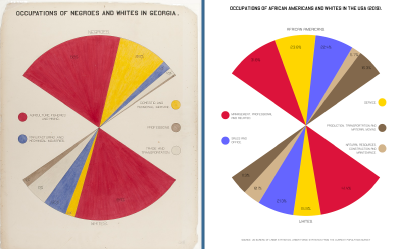
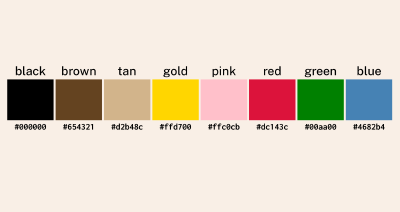
Several Network members spent February assembling this initial set of tools to honor Black History Month 2021. These tools offer design specifications and coding tools to help designers, artists, developers, writers, and scholars who want to visualize their data in the “Dubois Style” of graphs created by sociologist W. E. B Dubois' and his team for the 1900 Paris exposition.
Additional Resources and Contributions
Du Boisian replication using Excel from Philip Cohen
Du Boisian replication using Python from Camila Alvarez
R theme from Vlad Enrique Medenica
The #TidyTuesday database of tweets in 2021 featuring dozens of images and links to R code for Du Boisian replications.
How To video series for Du Boisian Data Viz in Tableau
The #DuBoisChallenge on Twitter
“R Code for Du Bois spiral by Ijeamaka Anyene”
Black Design in America: African Americans and the African Diaspora in Graphic Design
Du Boisian Style Guide at github from AJ Starks
Du Boisian style fonts from Vocal Type